
When the Government Shuts Down, the Data Goes Dark 🔦
Economists, policymakers, and models like my GDP nowcast are suddenly flying blind.

There’s a lot of bad stuff that comes with a government shutdown — delayed Veteran’s benefits, slower tax processing, fewer livestock and agricultural inspections, children’s nutrition assistance cuts, to name a few. Frankly, disrupting these functions could be a teachable moment for people who genuinely have no idea what government actually does.
On a less consequential level, government shutdowns are super annoying for economists and data nerds because the official, high-quality data slows to a trickle. For most people, the difference between a 4.3% or 4.4% unemployment rate is immaterial; however, for data-dependent institutions trying to figure out real-time policy changes (e.g. Federal Reserve interest rate cuts), this is a big problem. If the official unemployment rate jumped in September, the Fed really needs to know now, not weeks or months later.
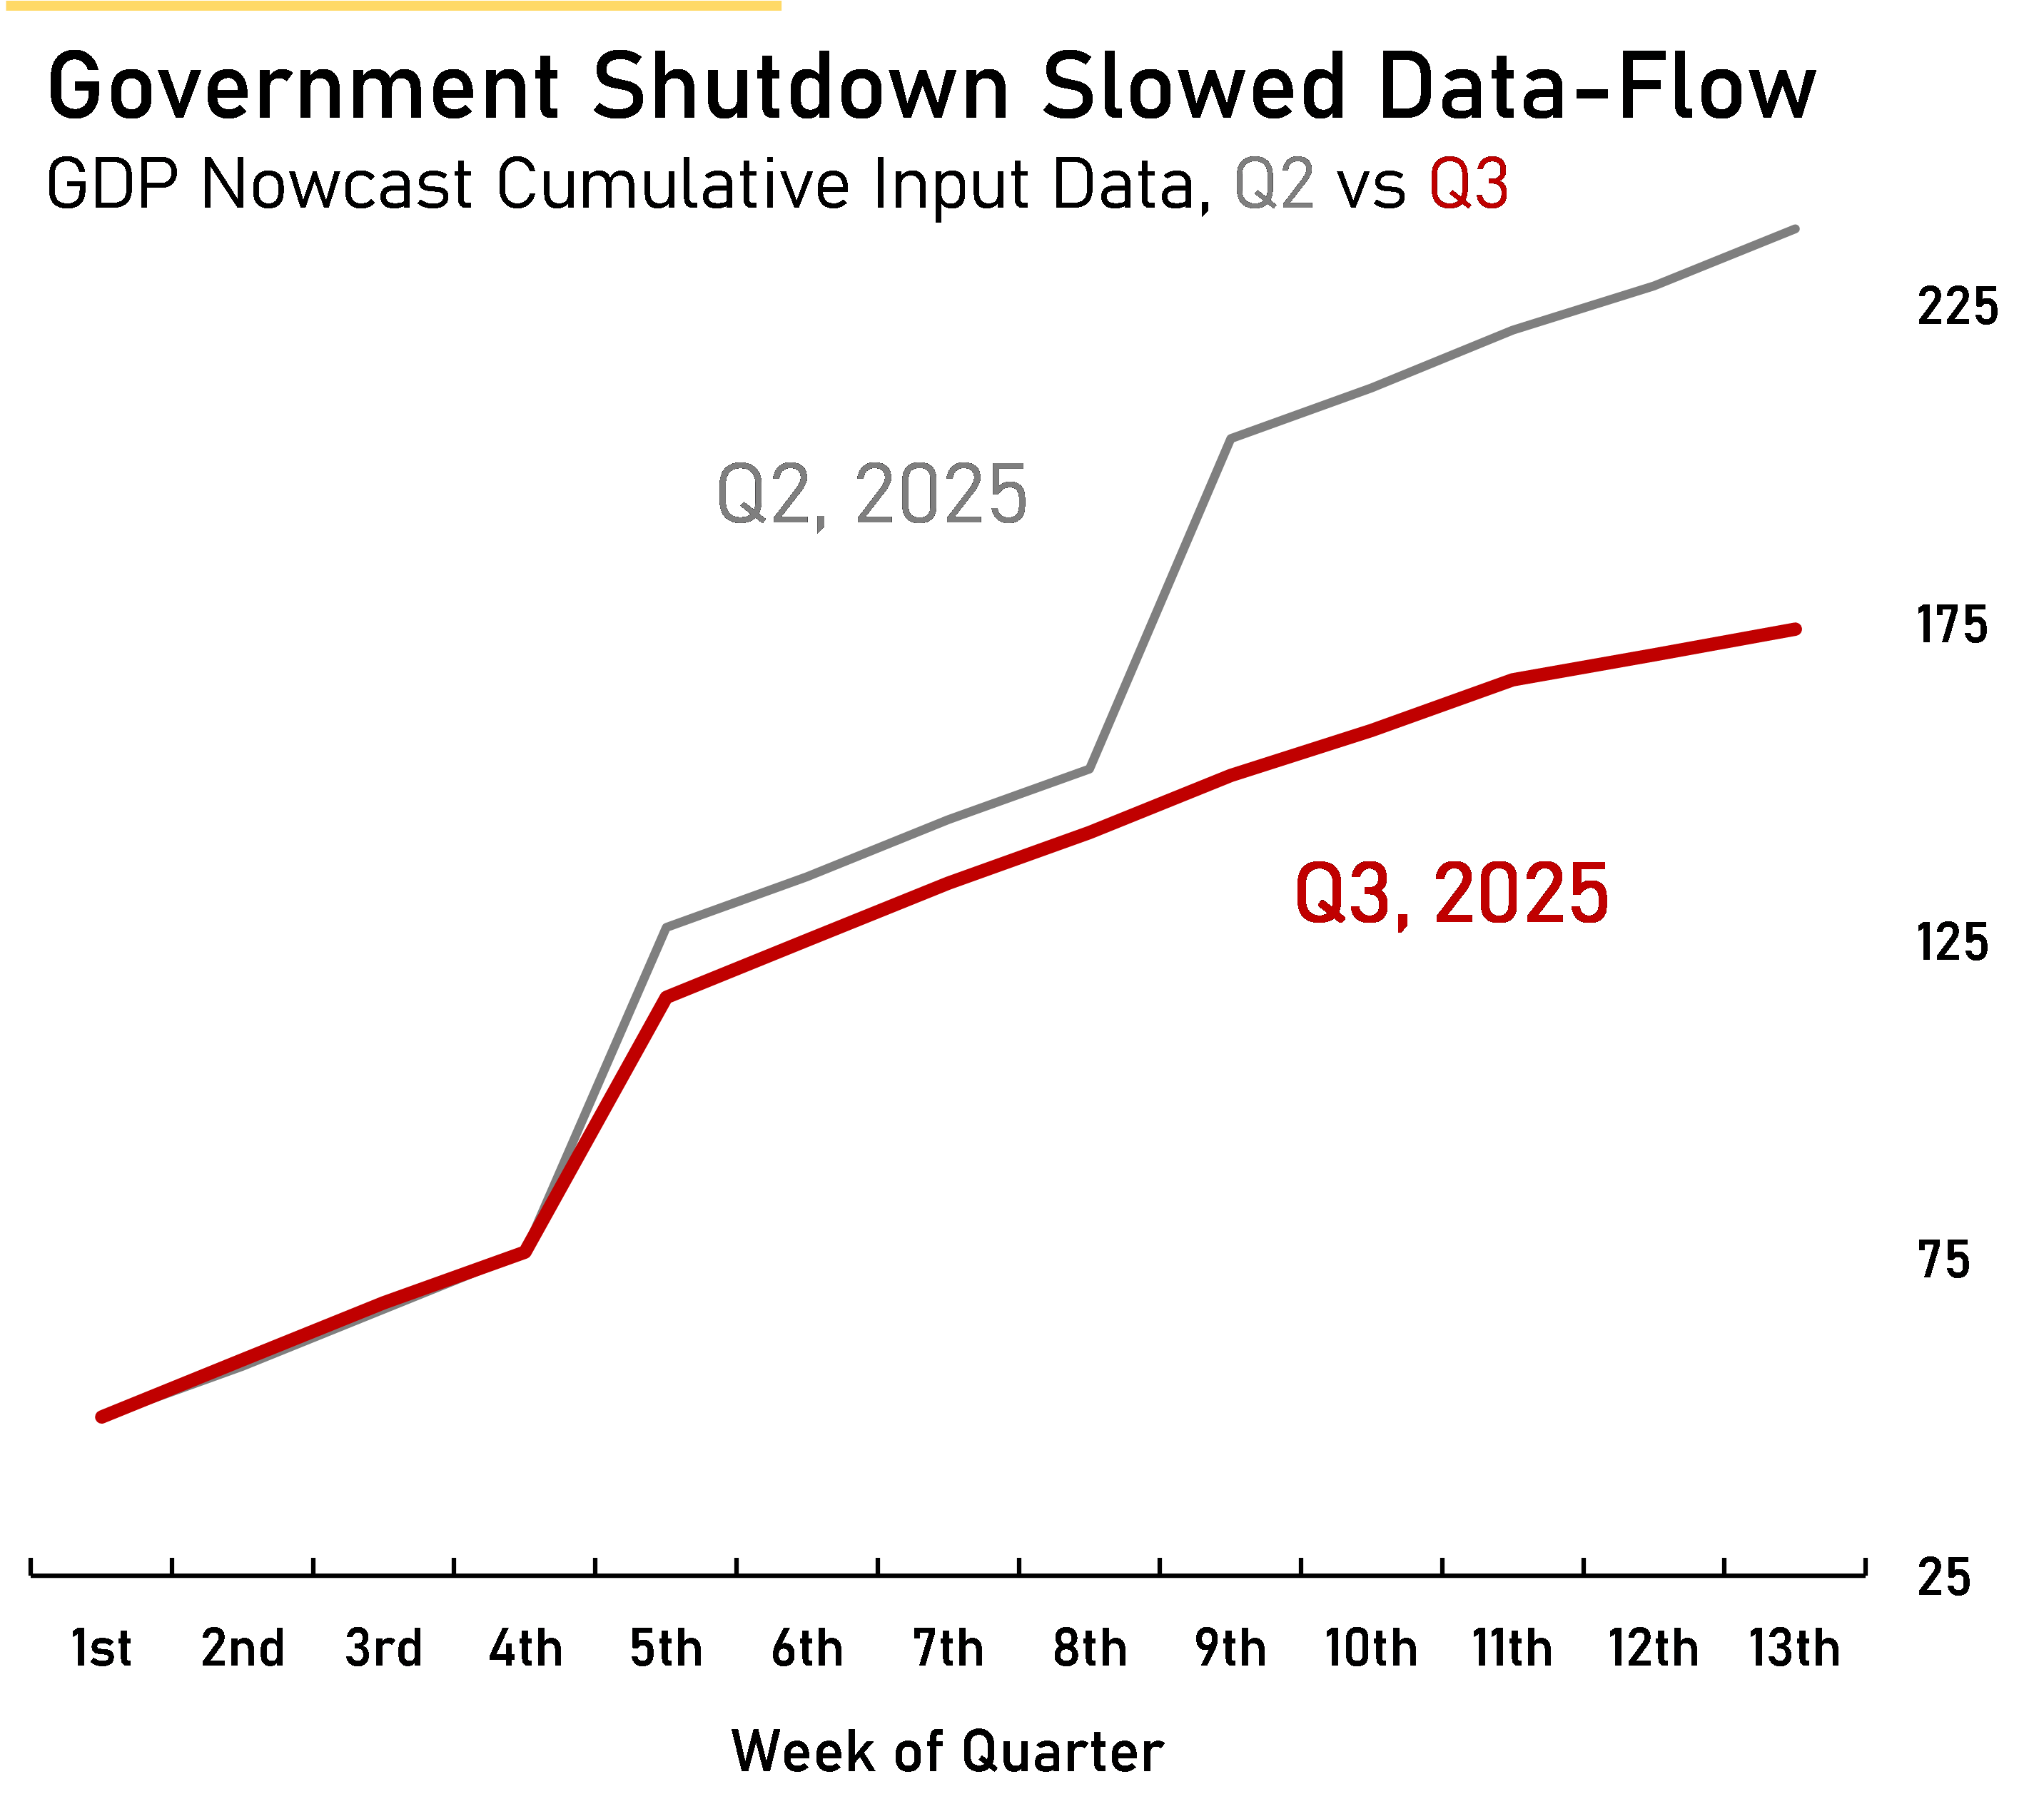
My own GDP nowcast ingests a lot of official data. In a normal quarter, the model would use around 240 data points (excluding market data, which updates more frequently). This quarter, it’s missing roughly 27% of that information — a big hole for a model that depends on the steady hum of government statistics.
In the meantime, creative analysts are using alternative economic indicators to fill the data gaps. Fellow Substack writers Daniel Bachman and Joseph Politano have good examples. OpenTable, for example, publishes daily data on restaurant seating. Interestingly, D.C. restaurant seating has averaged 0% growth since the shutdown began, compared with about +11% growth nationwide. While a fun academic exercise, I doubt J-Pow is making trillion-dollar interest rate decisions based on OpenTable stats.