
Thoughts on housing supply, inventory, & affordability 🏘️🏘️🏘️
Housing inventory per household increased a lot in 2023 -- continuing that trend should help with home affordability

Housing is a weirdly contentious topic. Housing Twitter attracts plenty of angry replies, and the NIMBY comments flood housing development articles (“we want lower rent, not more condos!” 🙄). Snark aside, I do think that most anti-development sentiment comes from genuine frustration with the housing market — people really do deserve lower rent and house prices.
It’s terrible for the economy overall that the most productive, dynamic, high-paying parts of the country exclude people through outrageous housing costs and an unwillingness to build. The National Association of Realtor’s housing affordability index is the worst it has ever been, but I predict that will turn around soon!
Luckily, I think we’re turning a corner on housing. The data on new homes under construction is looking better, but, more importantly, the supply of homes available relative to households increased for the first time in 15 years in 2023. Relative to overall population, housing supply has been fairly high for several years, but I don’t think this is the right analysis (households need homes, not every individual person).
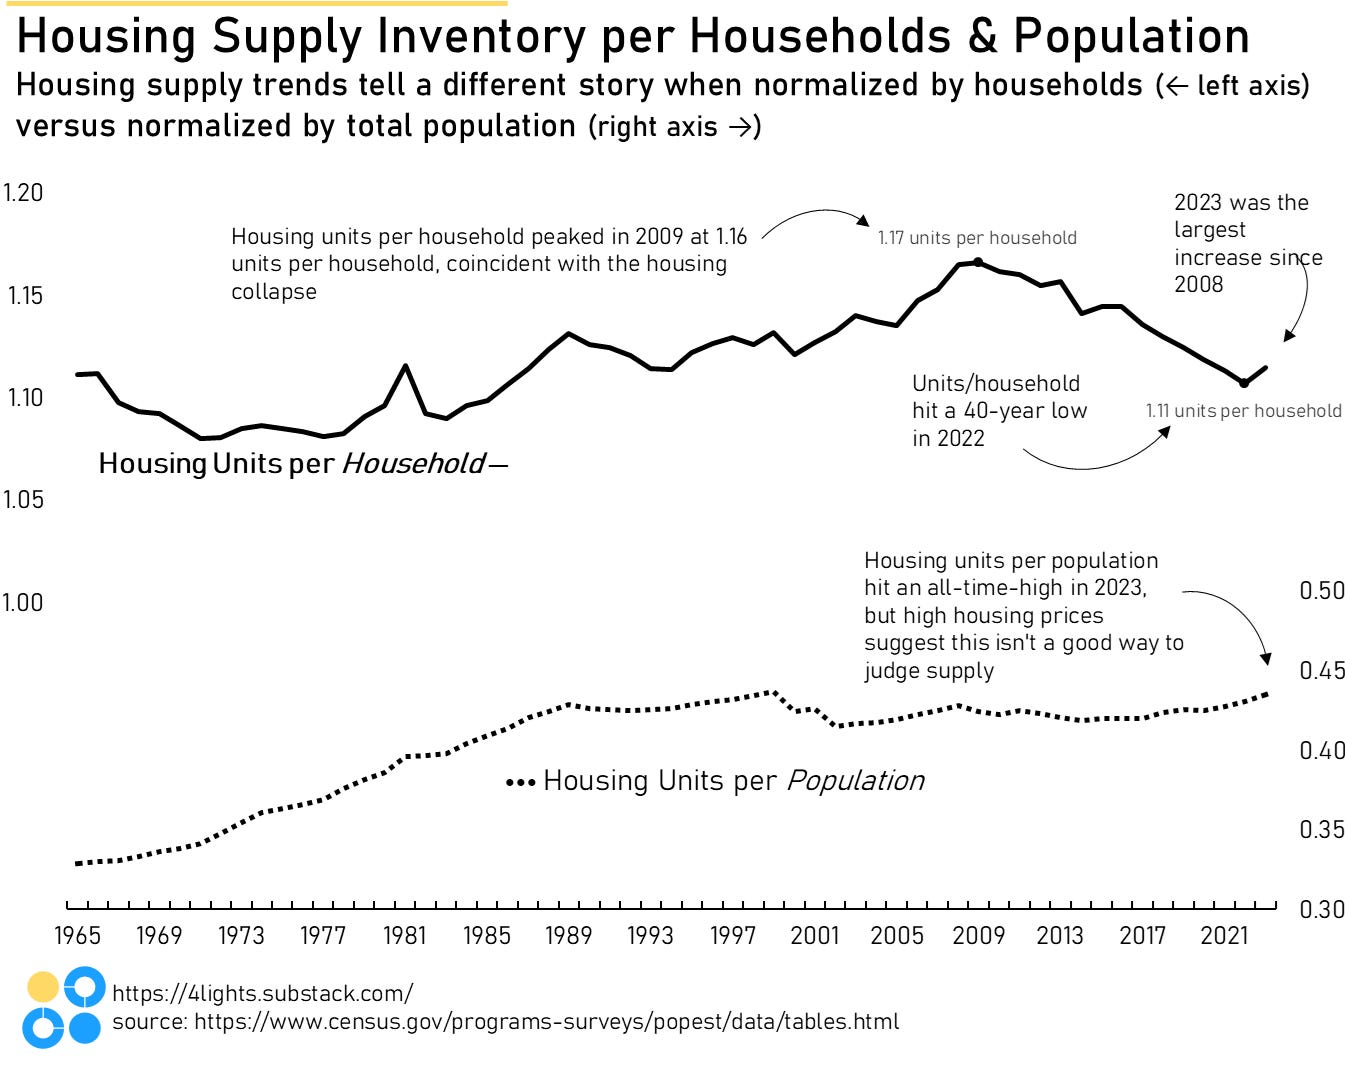
Housing inventory per household peaked in 2009 (didn’t something else related to housing happen around then?) and has been falling ever since — until 2023. 2023 saw the largest increase in housing inventory per household since 2008. The new construction boom plus the change in actual supply suggests prices will ease in the next few years. More supply, easing prices, and lower mortgage interest rates would be huge for first-time homebuyers.
Unfortunately, the Census does not provide data for households on a regional or state-by-state level. However, using some fancy math, I tried to estimate the household totals on a regional level. The trends align with the typical narratives.
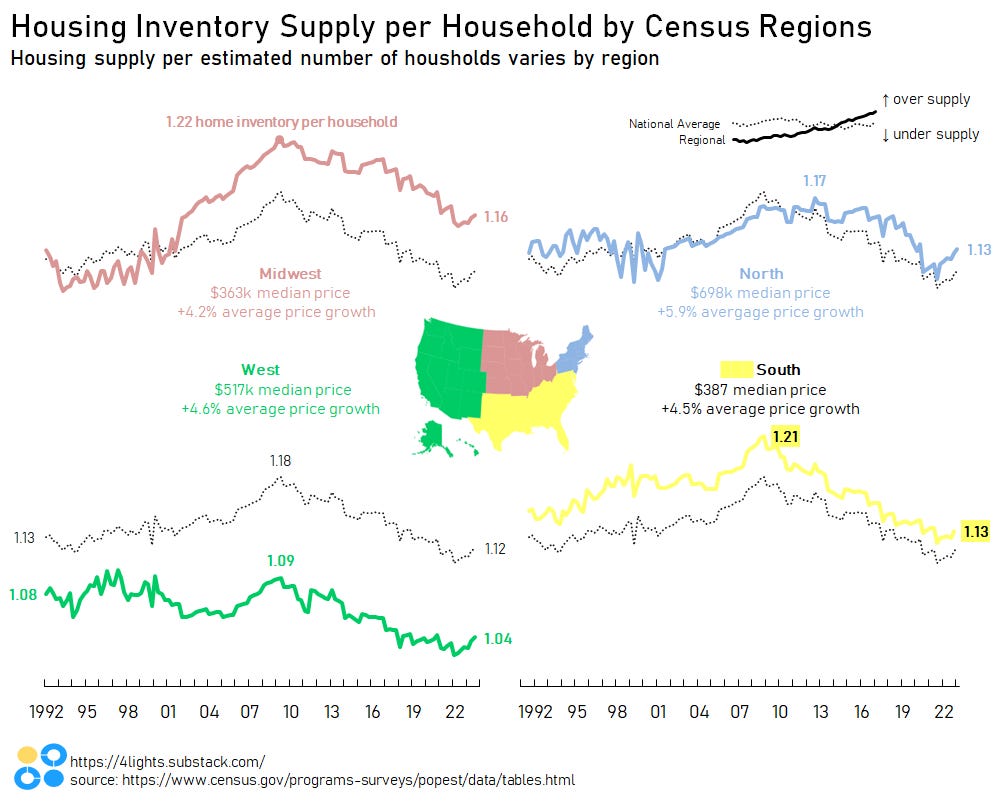
Midwest: the good-old Midwest has had its challenges (see belt comma rust). Cities like St. Louis and Detroit have lost huge percentages of their population. These population drains leave a lot of excess homes behind. A 20+ year streak of home oversupply has left the Midwest with the lowest median home prices in the nation and the lowest average annual price growth of the four regions.
West: the West has had the opposite problem. Decades of consistently low home supply has left the West with the second highest median home prices and second highest price growth. California’s inability to build housing (particularly in the ultra-wealthy San Francisco area) is famous in housing policy and zoning reform circles.
Northeast: the Northeast is pretty consistent with the overall national average, but is generally considered to be lacking housing inventory. Supply did start ticking upwards ahead of the national trend in late 2020, but that might be due to migration from the New York area during the pandemic. The North has the highest median home prices and the highest price growth of the regions.
South: the South has consistently maintained housing supply higher than the national average for the last 30 years. However, supply relative to households has fallen quickly since the 2009 peak. The overall population is growing very fast in the South - quicker than any other region. Additionally, the more “business-friendly” environment of the South likely allows for quicker additions to housing inventory. Home prices in the South are low, and price growth has been the second slowest of the four regions.
So, does this mean that the supply, at 1.04 for West Region, is MORE than than the households? If so, is that from second homes?