
In defense of "correlation"
Correlation is not causation, but correlation isn't just two lines on a graph, either.

You prepare a nice series of charts for a presentation. The presentation is going well until you get to a slide showing a relatively strong relationship between two variables. Suddenly, Doug blurts out “CoRreLaTiOn iS nOt cAusAtiOn”. Everyone nods. Your career is over.
True, correlation is not causation; however, a lot of people fail to establish correlation in the first place. Correlation is not just overlaying two lines on a graph - there are real measures of correlation, and correlation is a necessary condition for causation.
There are some amusing fake correlation websites that illustrate Doug’s point. For example:
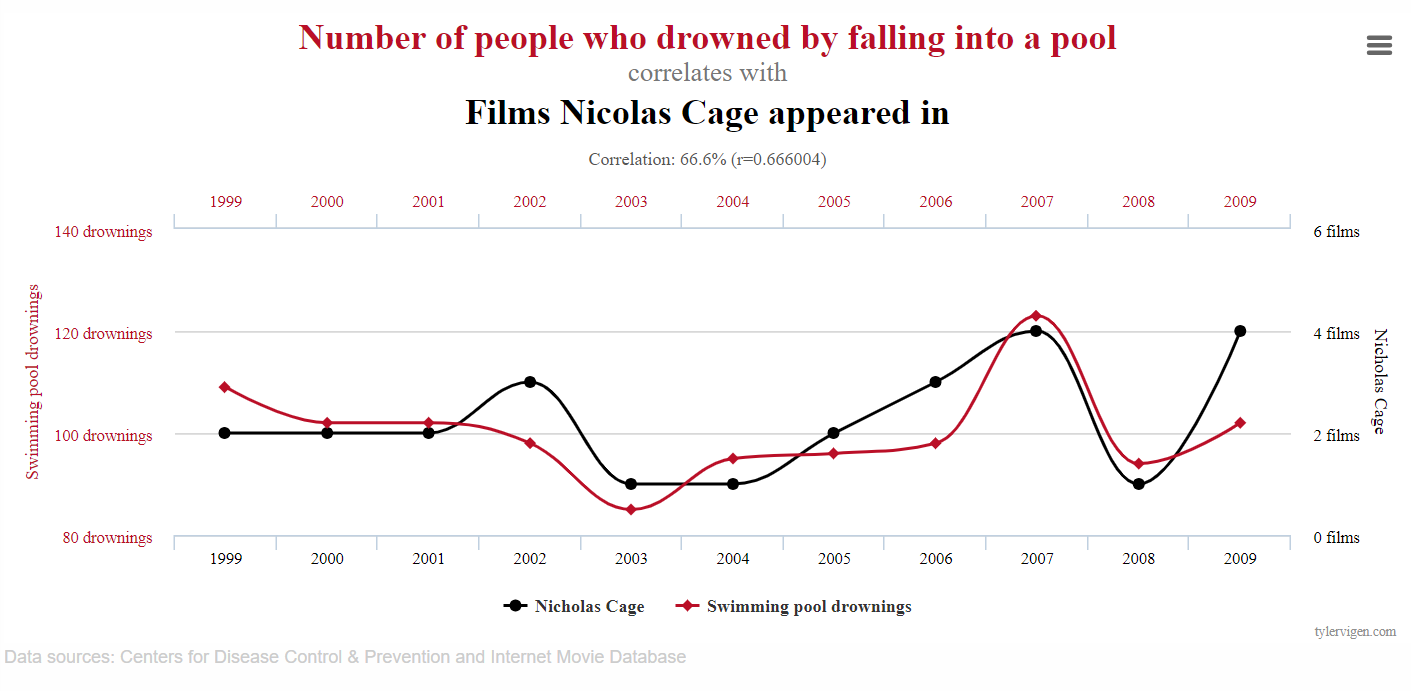
First red flag: never trust dual axis graphs - they are an especially bad form of data visualization and often misleading. A well-selected axis choice can make two totally unrelated time-series appear to move in tandem.
🚩🚩🚩
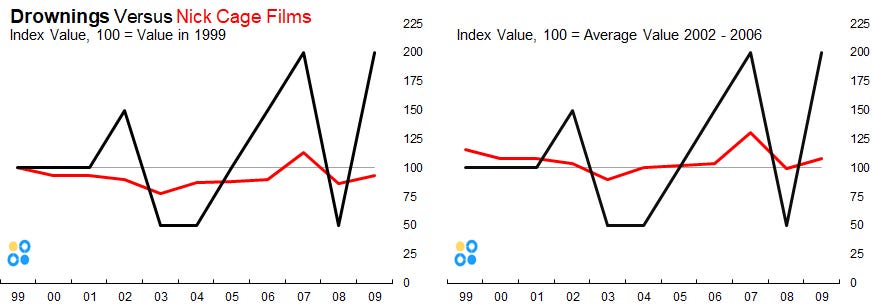
Now, consider applying a basic set of analytics to the data.
Indexing: Indexing is a method where the entire data series is shown as a value relative to a point on the series (or an average of multiple points). This is a common technique in economics where the actual value of the thing being measured is not easy to quantify; however, the value relative to a point in time provides meaning. For example, the actual Consumer Price Index is the price levels relative to 1982 - 1984. Typically, the index level is relative to 100 or 1. Back to Nick Cage, these two indexes (indices?) are constructed from the data series. Notice the correlation depicted in the original graph looks far less convincing when the data is indexed to different points.
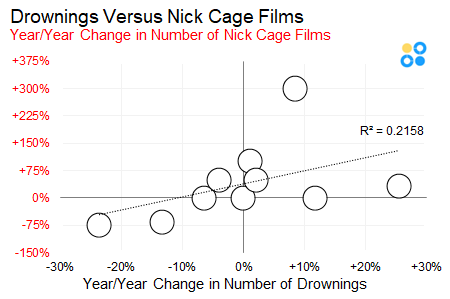
Change Versus Change: Another method to test for actual correlation is to plot the change in one variable (either actual or percentage) against the change in the other. This gives a much better sense of whether or not the movement between the two variables are proportional and correlated. Again, with Nick Cage data, the variables are not moving in proportion to each other. The R2 is just bad.
Yes, overreliance on correlations can be dangerous in pure scientific and academic settings. But, for casual business settings, establishing a strong correlation between different variables can be a powerful tool. The key is to start by showing actual correlation. Two lines on a graph that sort of move in tandem is not correlation.