

People interested in climate science are usually familiar with some famous graphs: the hockey stick, climate stripes, or Haywood plots for the ultra nerds. But what about cherry blossoms?
It turns out that cherry blossom peak bloom dates offer an elegant way to visualize a changing climate because warmer winters produce earlier blooms. Japanese researcher Yasuyuki Aono spent years meticulously extracting cherry blossom peak bloom dates from over 1,000 years of written records in Kyoto, Japan.
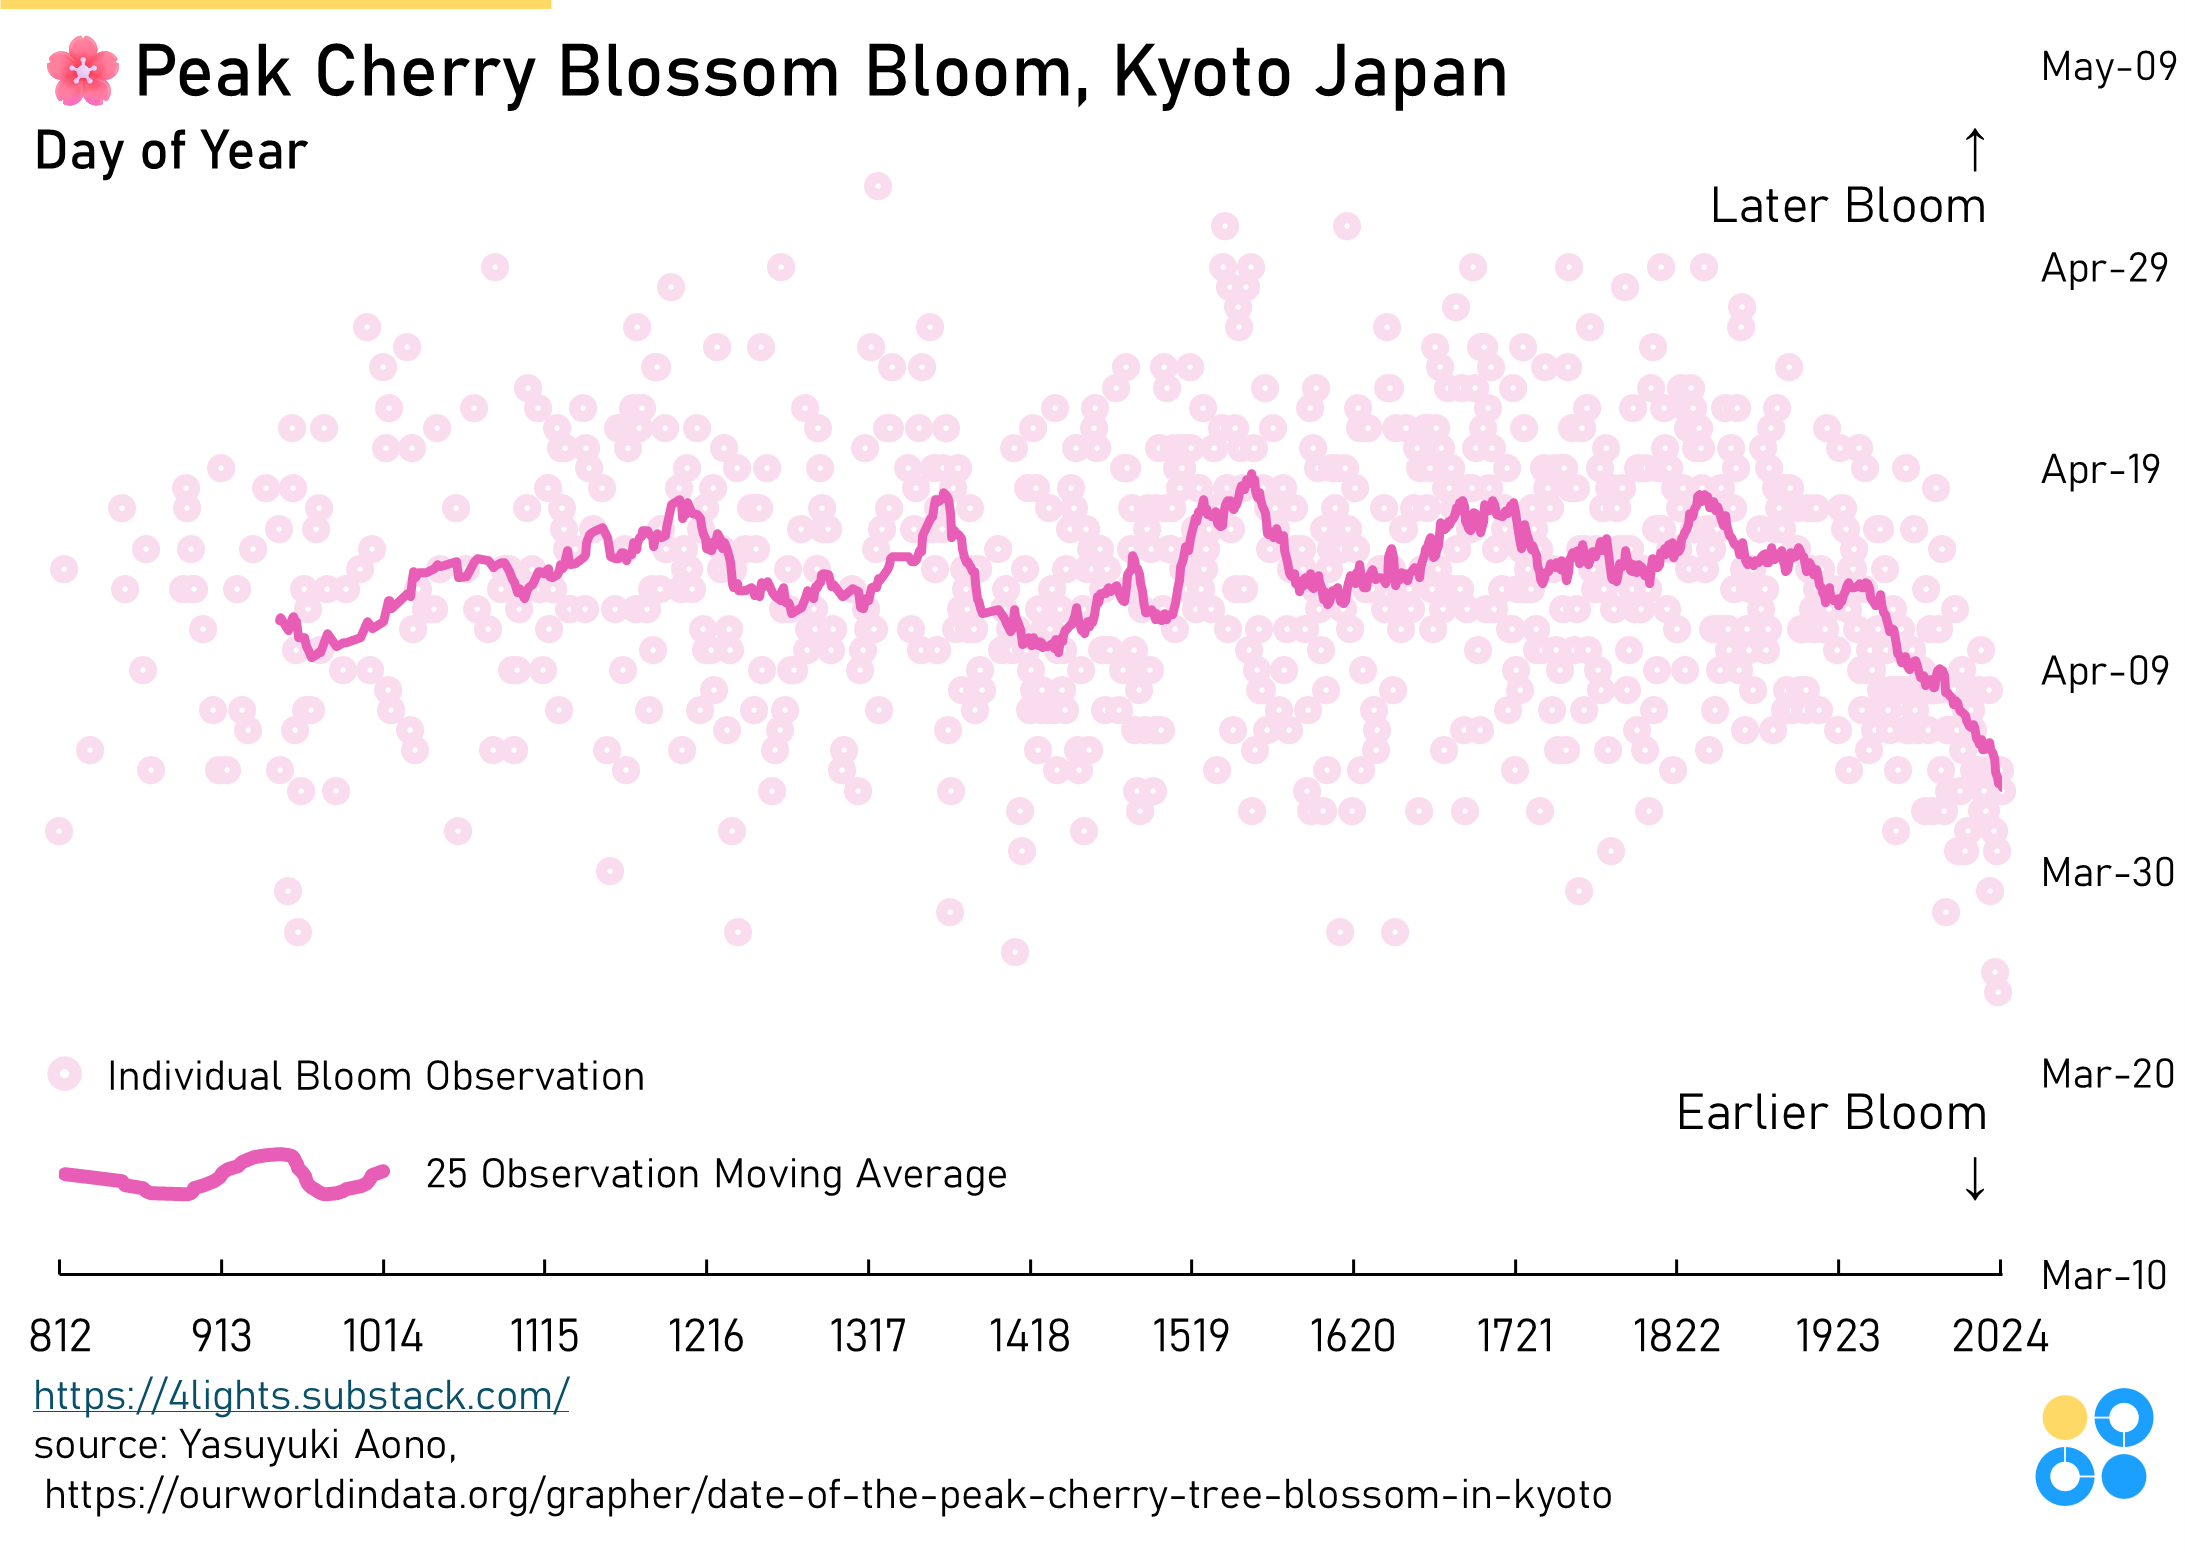
The Economist published a version of this graphic nearly 10 years ago, and the excellent Our World In Data team maintains it as an ongoing visual.
In Washington, DC (where I live), cherry blossoms are an equally big deal, but we don’t have records stretching millennia to observe deeper trends. Still, there is a general trend towards earlier blooms starting from the start of the easily available data.
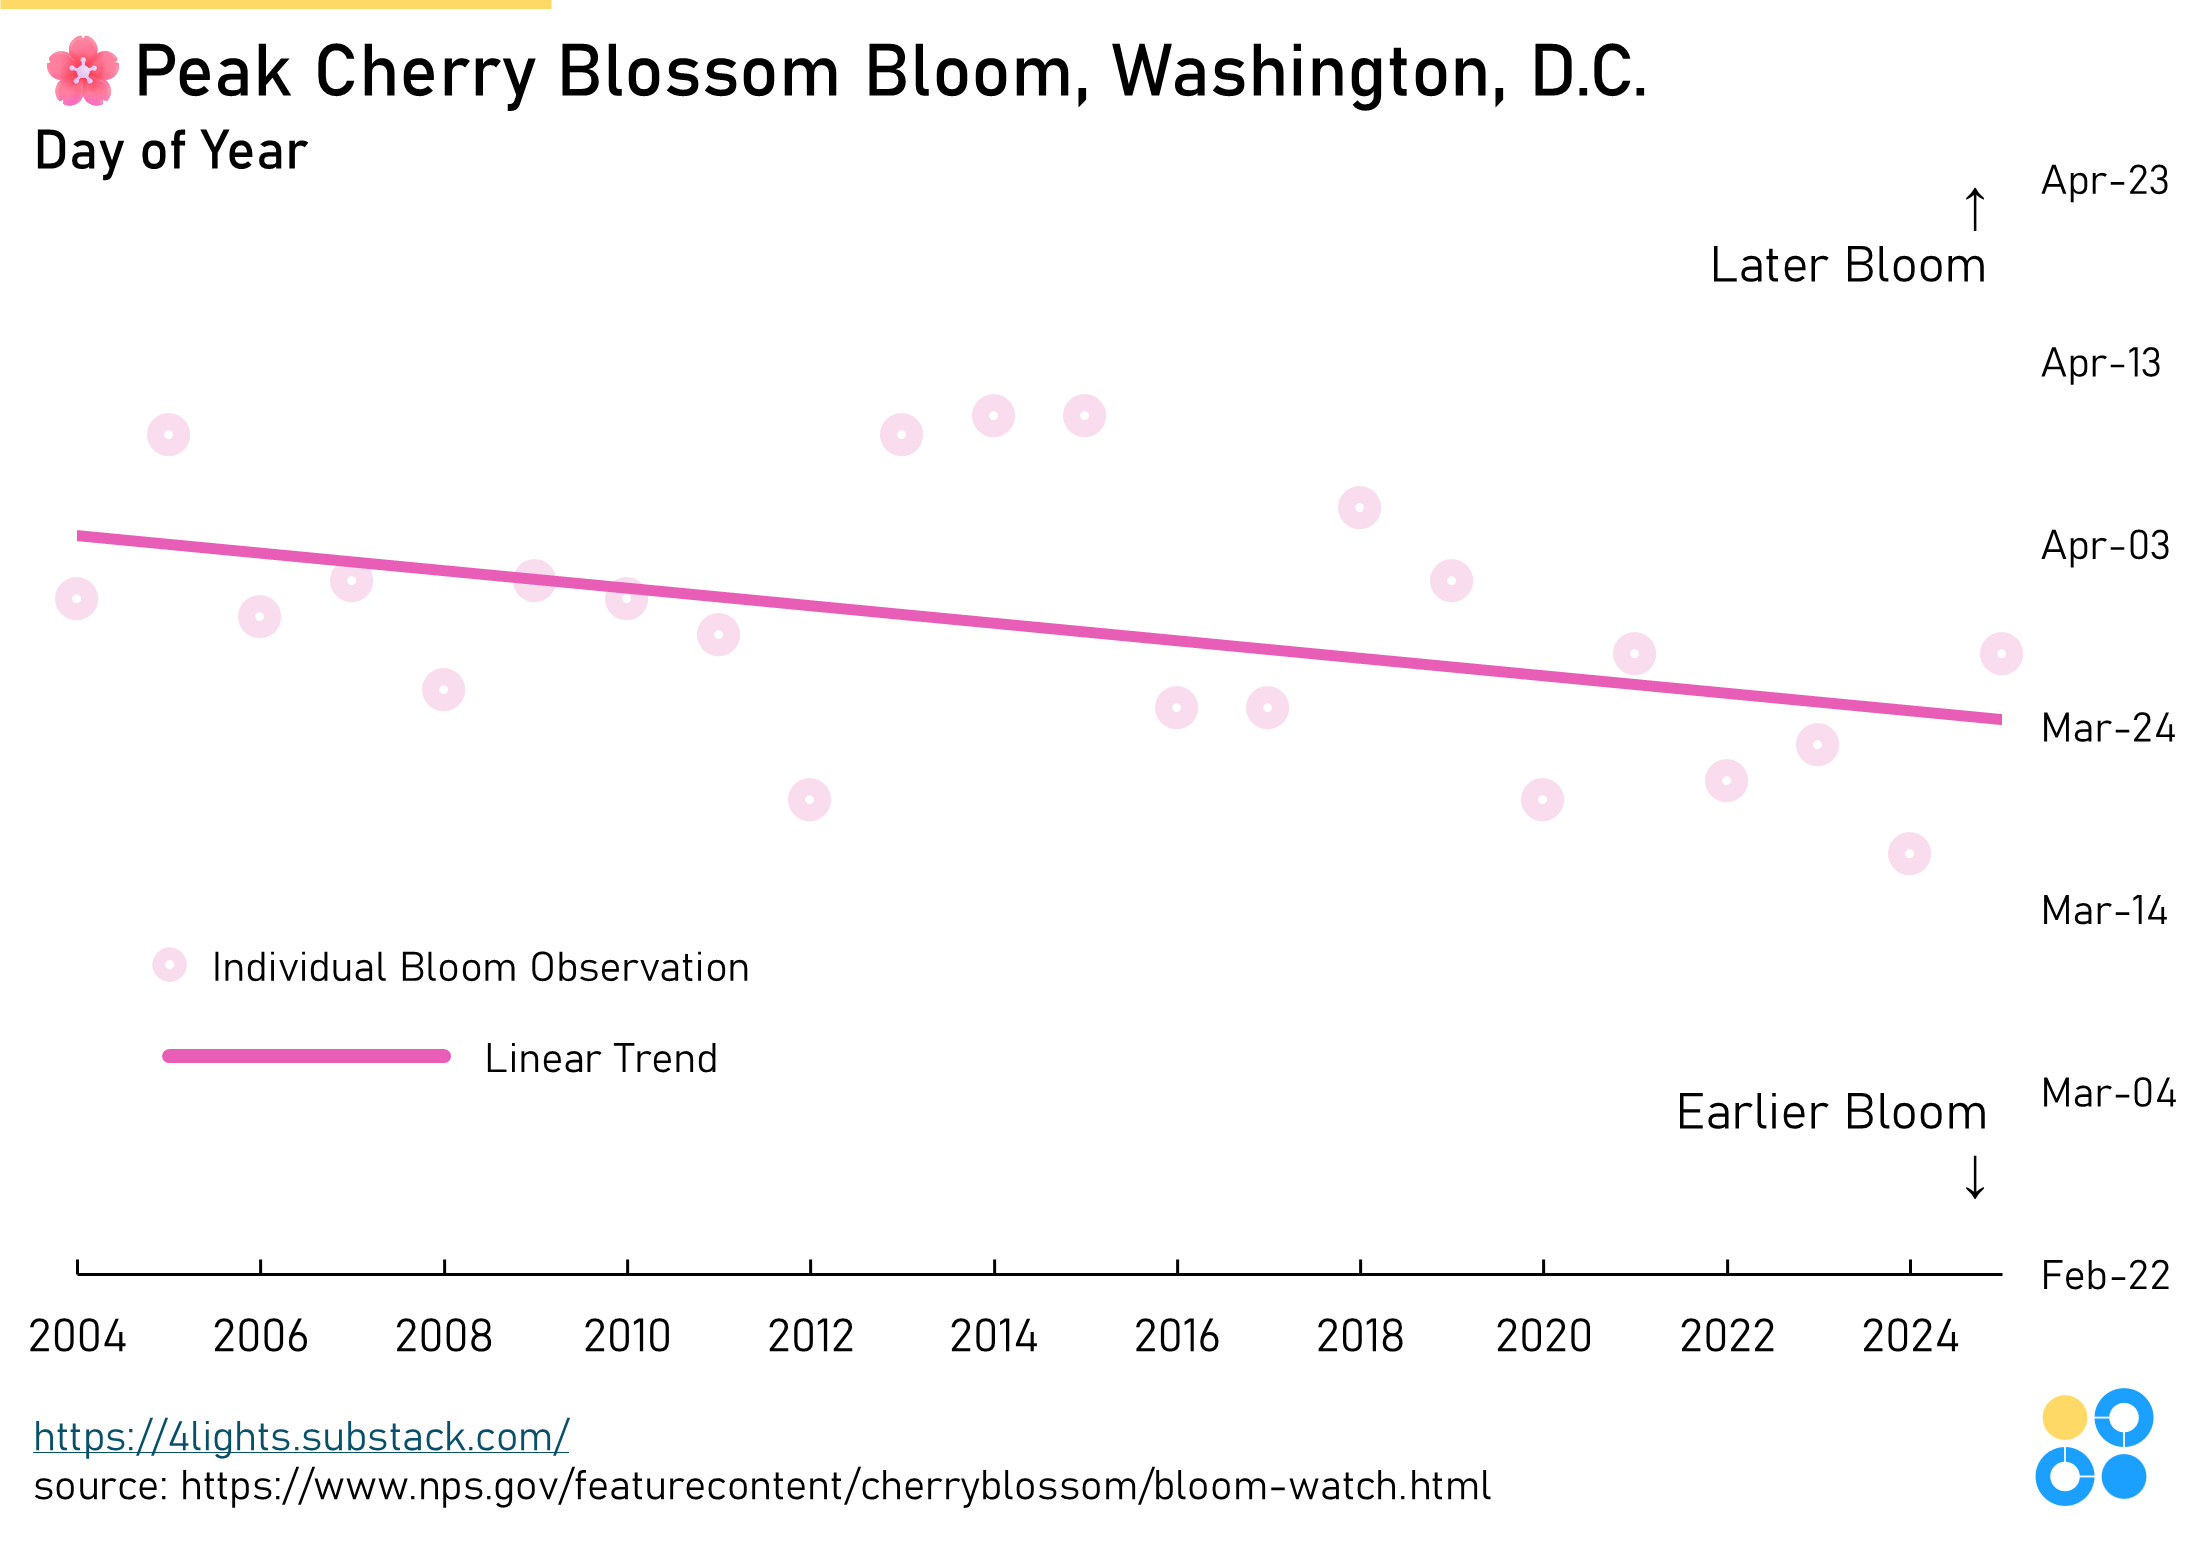
The DC version of this trend is certainly less convincing (and far less elegant), but both datasets point in the same direction — earlier and earlier blooms caused by warmer and warmer winters.
🌸🌸🌸