
🤖 ChatGDP (Q2, 2026: +2.2%)
Another economic "nowcast" brought to you by AI (and it thinks GDP is pretty good this quarter)

A few months ago, I introduced ChatGDP — an experiment using Gemini to generate a daily AI-powered nowcast of U.S. real GDP growth. The system points Gemini at economic news RSS feeds and data sources and asks it to produce an independent forecast each day. Now that we’re well into Q2, it’s a good time to check in.
ChatGDP is currently estimating +2.2% growth for Q2, 2026, with a range of +1.4% to +3.0%. That’s up +0.6% from where it started the quarter.
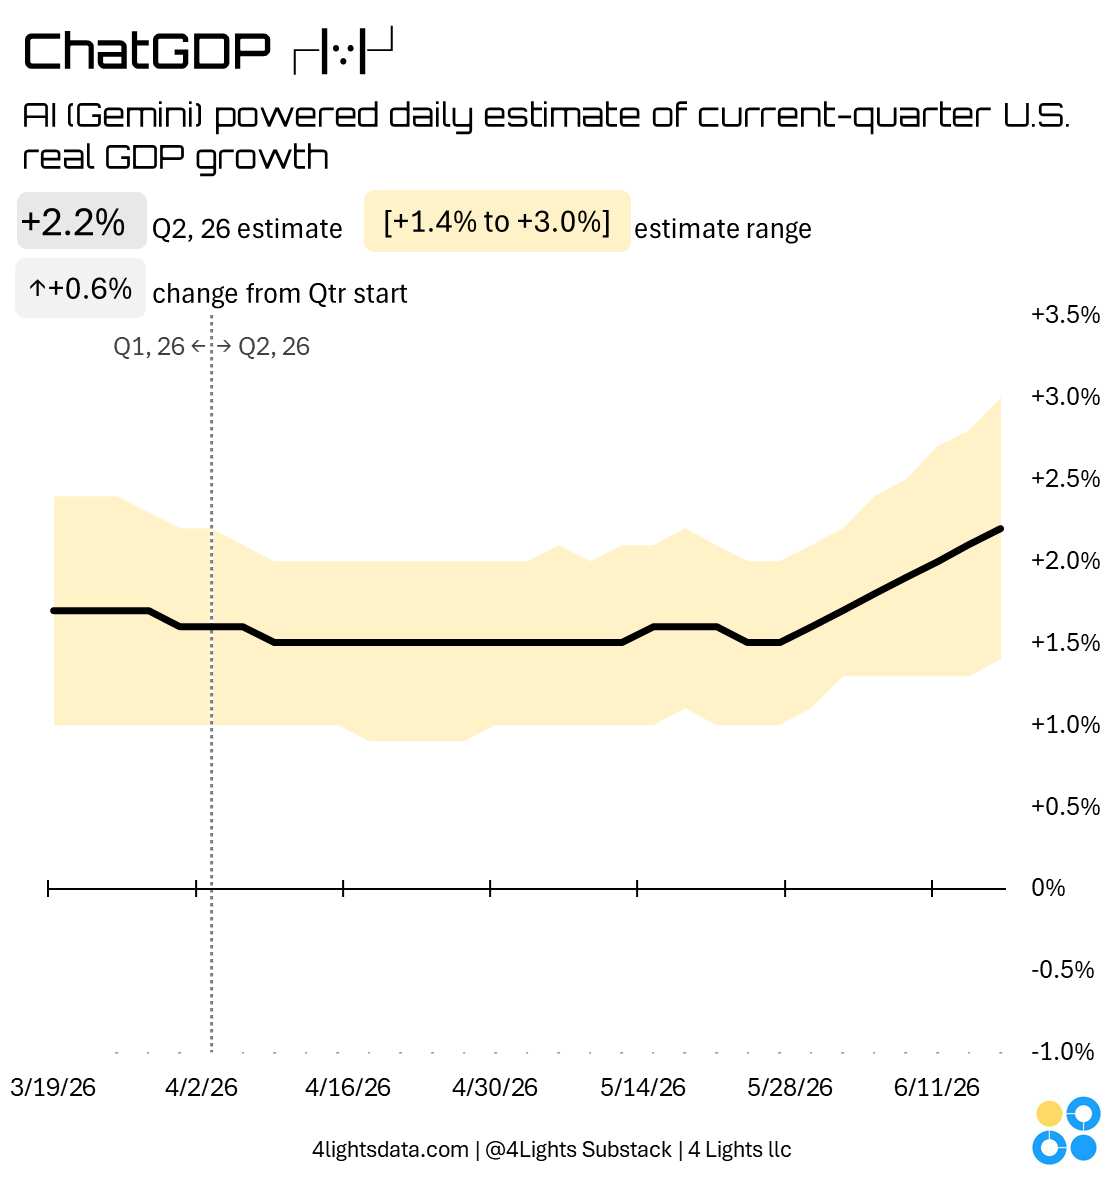
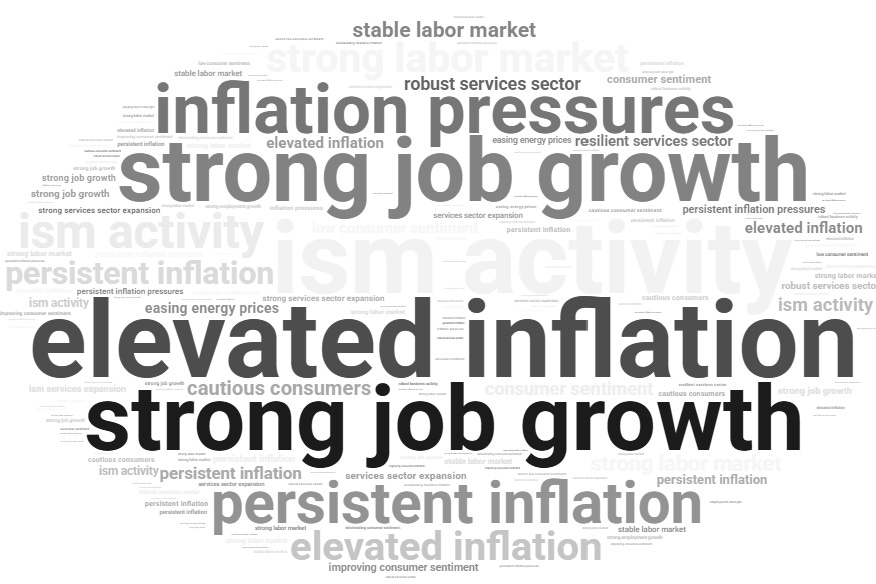
ChatGDP started Q2 around +1.6%, dipped slightly in early April, then ground sideways for most of May before jumping sharply higher in the last few weeks of the quarter. That late-quarter surge pushed the estimate to its current level. In addition to the numbers, Gemini also produces a daily set of key words to describe major themes in the economy.
How does it compare to other nowcasts? The Atlanta Fed’s GDPNow is currently tracking at +3.0% which is notably more optimistic than ChatGDP’s nowcast; Gemini may be weighing some downside risks that the Atlanta Fed’s model isn’t capturing.
The Prompt
Prompts matter a lot when working with AI. These models are also only trained on data through a specific date, so we have to point Gemini toward live news feeds and data sources to generate a real-time forecasts. In this case, Gemini is looking at Google RSS feeds covering economic news, the stock market, and jobs reports. Here is the full prompt:
You are an expert U.S. macroeconomic analyst and forecaster.

Using the following live economic headlines and indicators, generate an independent, data-driven forecast for U.S. real GDP growth (annualized SAAR) for the current quarter. Base your reasoning on qualitative trends from employment, inflation, ISM reports, consumer sentiment, spending data, and the stock market. Do not reference GDPNow or other official nowcasts.

Be explicit about uncertainty:
- Always provide a central forecast (most likely value).
- Include a plausible range that reflects confidence in your estimate.
- The range should normally be at least ±0.3 percentage points wide, and up to ±1.5 if recent data are mixed or volatile.

Output your response exactly in this format:
Forecast: [number]%
Range: [low% – high%]
Key Drivers: [short comma-separated list]
Commentary: [2–4 sentences summarizing reasoning and risks]